Python Example

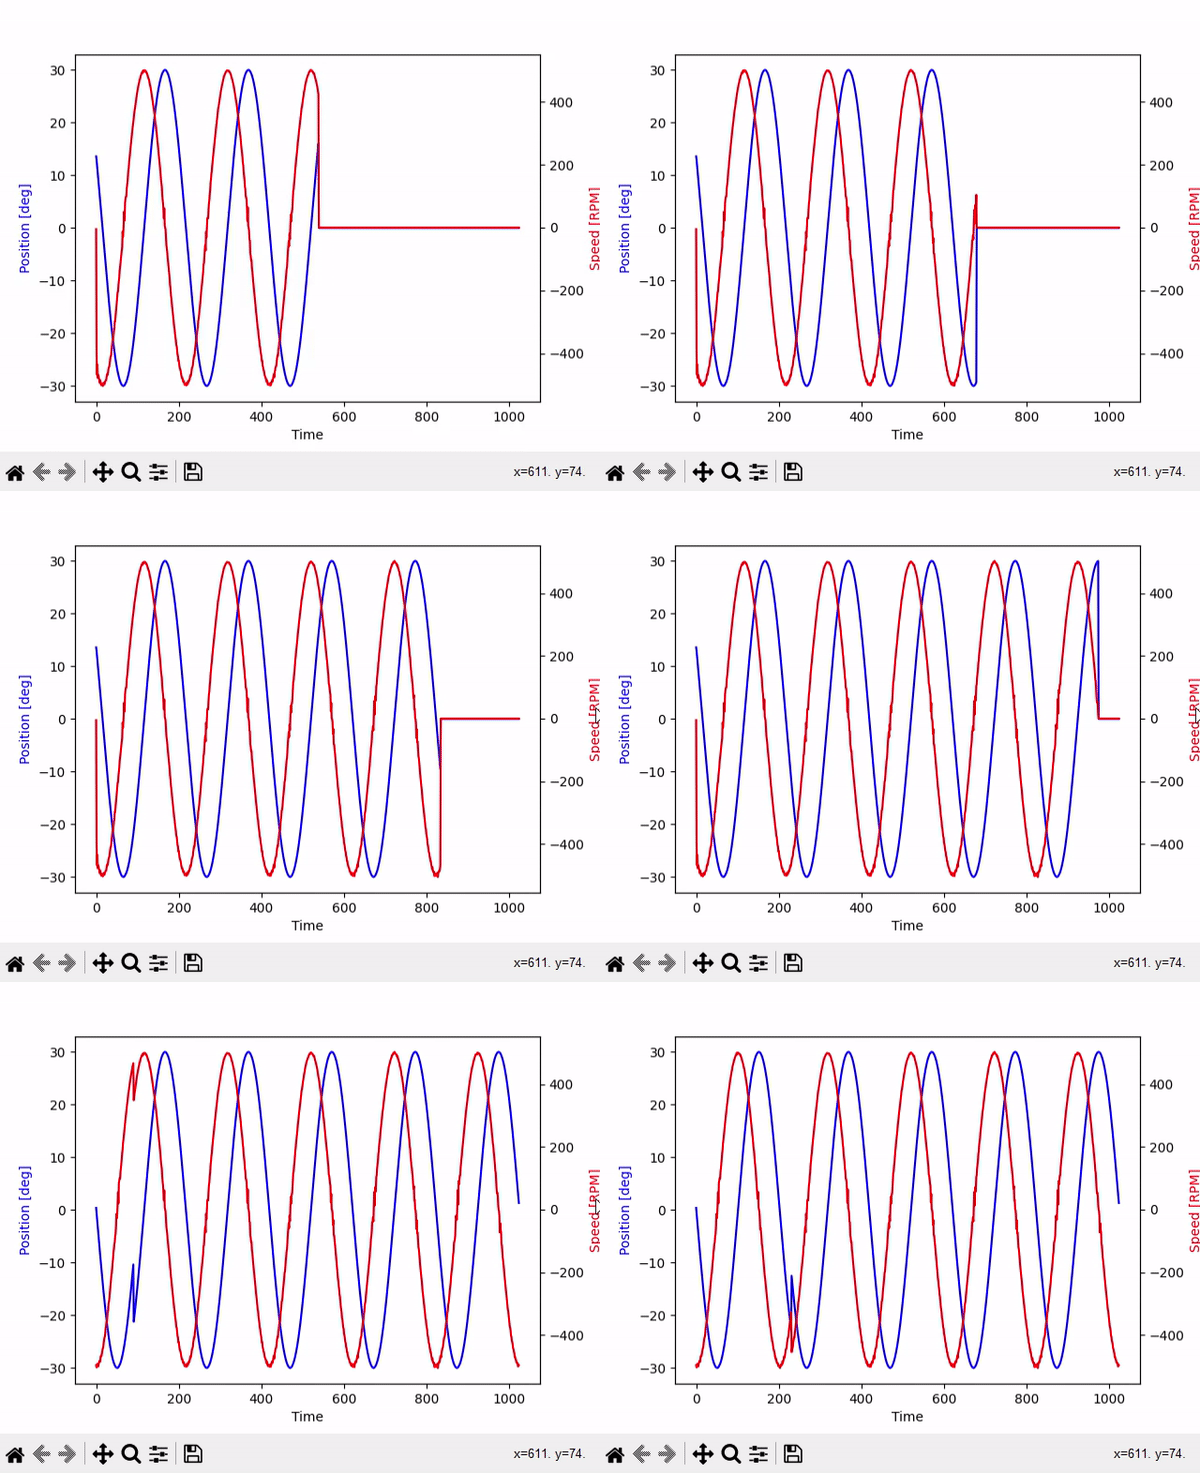
The following example shows how to interface the HDrive with Python. The Example plots the current position and speed inside a graph while the motor is running in oscillation mode.


Drive configuration


Enviroment configuration

To draw graphs out of Python, we need to use a plotting library like matplotlib. You can install matplotlib in Python using the following line:

Matplotlib is a plotting library for Python that provides a variety of tools for creating different types of plots, charts, and graphs. It can be used to visualize data in a variety of formats and is widely used in scientific research, data analysis, and visualization. It is a third-party library that can be installed using pip or conda package managers. Install matplotlib with the following line:

pip install matplotlib

Python Code

Plain text
Copy to clipboard
Open code in new window
EnlighterJS 3 Syntax Highlighter
import socket
import struct
import threading
import time
import signal
import matplotlib.pyplot as plt
def tcp_send_command_thread(stop_event):
# Configure Socket
with socket.socket(socket.AF_INET, socket.SOCK_STREAM) as s:
# Connect to motor
s.connect(('192.168.1.102', 1000))
# Compose String to send to the drive
st = '"<control pos=\"15000\" frequency=\"20\" torque=\"200\" mode=\"135\" offset=\"0\" phase=\"0\" />"'
s.sendall(st.encode('ascii')) # send XML command
# The main thread can continue executing other tasks
while not stop_event.is_set():
time.sleep(1)
def receive_udp_data(udp_port, stop_event, ring_buffer):
index = 0
# Configure Socket
with socket.socket(socket.AF_INET, socket.SOCK_DGRAM) as s:
s.bind(('', udp_port))
while not stop_event.is_set():
data, addr = s.recvfrom(132) # buffer size is 132 bytes
int_list = list(struct.unpack("<33i", data)) # interprete 33 int32 numbers
# Update the ring buffer
ring_buffer[index] = [int_list[0]*1e-3, int_list[1]/10.0, int_list[2]]
index = (index + 1) % len(ring_buffer)
def keyboard_interrupt_handler(signal, frame):
print("Keyboard interrupt received. Stopping the program.")
# Set the stop event to signal the thread to exit
stop_event.set()
# Exit the program
exit(0)
if __name__ == '__main__':
stop_event = threading.Event() # create an event object
# Initialize the ring buffer
ring_buffer = [[0, 0, 0] for i in range(10000)]
# create a thread that receives on UDP port 1001
udp_receive_thread = threading.Thread(target=receive_udp_data, args=(1001, stop_event, ring_buffer))
udp_receive_thread.start()
# create a thread that can send commands to the motor
tcp_send_command_thread = threading.Thread(target=tcp_send_command_thread, args=(stop_event,))
tcp_send_command_thread.start()
# Install the keyboard interrupt handler
signal.signal(signal.SIGINT, keyboard_interrupt_handler)
# Initialize the plot
plt.ion()
fig, ax = plt.subplots()
# The main thread can continue executing other tasks
while True:
# Get the latest data from the ring buffer
time_values = [entry[0] for entry in ring_buffer]
y_values = [entry[1] for entry in ring_buffer]
# Update the plot with the latest data
ax.clear() # Clear the previous plot
ax.plot(time_values, y_values) # y_values is the list of values you want to plot
ax.set_xlabel('Time') # Set the x-axis label
# Show the plot
plt.pause(0.0001) # Give the plot time to refresh
import socket import struct import threading import time import signal import matplotlib.pyplot as plt def tcp_send_command_thread(stop_event): # Configure Socket with socket.socket(socket.AF_INET, socket.SOCK_STREAM) as s: # Connect to motor s.connect(('192.168.1.102', 1000)) # Compose String to send to the drive st = '"<control pos=\"15000\" frequency=\"20\" torque=\"200\" mode=\"135\" offset=\"0\" phase=\"0\" />"' s.sendall(st.encode('ascii')) # send XML command # The main thread can continue executing other tasks while not stop_event.is_set(): time.sleep(1) def receive_udp_data(udp_port, stop_event, ring_buffer): index = 0 # Configure Socket with socket.socket(socket.AF_INET, socket.SOCK_DGRAM) as s: s.bind(('', udp_port)) while not stop_event.is_set(): data, addr = s.recvfrom(132) # buffer size is 132 bytes int_list = list(struct.unpack("<33i", data)) # interprete 33 int32 numbers # Update the ring buffer ring_buffer[index] = [int_list[0]*1e-3, int_list[1]/10.0, int_list[2]] index = (index + 1) % len(ring_buffer) def keyboard_interrupt_handler(signal, frame): print("Keyboard interrupt received. Stopping the program.") # Set the stop event to signal the thread to exit stop_event.set() # Exit the program exit(0) if __name__ == '__main__': stop_event = threading.Event() # create an event object # Initialize the ring buffer ring_buffer = [[0, 0, 0] for i in range(10000)] # create a thread that receives on UDP port 1001 udp_receive_thread = threading.Thread(target=receive_udp_data, args=(1001, stop_event, ring_buffer)) udp_receive_thread.start() # create a thread that can send commands to the motor tcp_send_command_thread = threading.Thread(target=tcp_send_command_thread, args=(stop_event,)) tcp_send_command_thread.start() # Install the keyboard interrupt handler signal.signal(signal.SIGINT, keyboard_interrupt_handler) # Initialize the plot plt.ion() fig, ax = plt.subplots() # The main thread can continue executing other tasks while True: # Get the latest data from the ring buffer time_values = [entry[0] for entry in ring_buffer] y_values = [entry[1] for entry in ring_buffer] # Update the plot with the latest data ax.clear() # Clear the previous plot ax.plot(time_values, y_values) # y_values is the list of values you want to plot ax.set_xlabel('Time') # Set the x-axis label # Show the plot plt.pause(0.0001) # Give the plot time to refresh
import socket
import struct
import threading
import time
import signal
import matplotlib.pyplot as plt

def tcp_send_command_thread(stop_event):
    # Configure Socket
    with socket.socket(socket.AF_INET, socket.SOCK_STREAM) as s:
        # Connect to motor
        s.connect(('192.168.1.102', 1000))

        # Compose String to send to the drive
         st = '"<control pos=\"15000\" frequency=\"20\" torque=\"200\" mode=\"135\" offset=\"0\" phase=\"0\" />"'
        s.sendall(st.encode('ascii')) # send XML command  
        
        # The main thread can continue executing other tasks
        while not stop_event.is_set():
            time.sleep(1)
    
def receive_udp_data(udp_port, stop_event, ring_buffer):
    index = 0
    # Configure Socket
    with socket.socket(socket.AF_INET, socket.SOCK_DGRAM) as s:
        s.bind(('', udp_port))

        while not stop_event.is_set():
            data, addr = s.recvfrom(132) # buffer size is 132 bytes
            int_list = list(struct.unpack("<33i", data)) # interprete 33 int32 numbers
            
            # Update the ring buffer
            ring_buffer[index] = [int_list[0]*1e-3, int_list[1]/10.0, int_list[2]]
            index = (index + 1) % len(ring_buffer)

def keyboard_interrupt_handler(signal, frame):
    print("Keyboard interrupt received. Stopping the program.")
    # Set the stop event to signal the thread to exit
    stop_event.set()

    # Exit the program
    exit(0)

if __name__ == '__main__':
    stop_event = threading.Event()  # create an event object

    # Initialize the ring buffer
    ring_buffer = [[0, 0, 0] for i in range(10000)]

    # create a thread that receives on UDP port 1001    
    udp_receive_thread = threading.Thread(target=receive_udp_data, args=(1001, stop_event, ring_buffer))
    udp_receive_thread.start()

    # create a thread that can send commands to the motor    
    tcp_send_command_thread = threading.Thread(target=tcp_send_command_thread, args=(stop_event,))
    tcp_send_command_thread.start()

    # Install the keyboard interrupt handler
    signal.signal(signal.SIGINT, keyboard_interrupt_handler)

    # Initialize the plot
    plt.ion()
    fig, ax = plt.subplots()
    
    # The main thread can continue executing other tasks
    while True:
        
        # Get the latest data from the ring buffer
        time_values = [entry[0] for entry in ring_buffer]
        y_values = [entry[1] for entry in ring_buffer]

        # Update the plot with the latest data
        ax.clear() # Clear the previous plot
        ax.plot(time_values, y_values) # y_values is the list of values you want to plot

        ax.set_xlabel('Time') # Set the x-axis label
        
        # Show the plot
        plt.pause(0.0001) # Give the plot time to refresh